
CBSE Class 12 Accountancy Chapter 10 notes (Tools For Financial Analysis) can help students improve their problem-solving skills and prepare for board exams with confidence. Students can read the Accountancy Class 12 Notes and practice various types of questions on Chapter 10, and develop their ability to assess the solutions. Scroll down this page to get the complete Accounts Notes on Class 10 PDF with lots of mind maps.
CBSE Class 12 Accountancy Chapter 10 Notes
Learn how to prepare and present financial accounts for companies with CBSE Class 12 Accountancy Chapter 10 Notes PDF. Class 12 Accountancy teaches how to record share capital transactions and handle debentures. Check out all CUET crash courses for Accounts, GAT, and language subjects.

Download CUET Accountancy Chapter 10 Notes PDF for Quick Revision
The CBSE Class 12 Accountancy Chapter 10 Notes cover the accounting procedures involved in dissolving partnerships and reconstituting firms. Check our best Careers Adda CUET crash courses for Accounts students, to complete the syllabus from our expert faculty.
Accountancy Notes for Chapter 10 – Tools For Financial Analysis
Check the highlights of the CBSE Class 12 Accountancy Chapter 10 Notes for tools for financial Analysis below:
Meaning of Tools for Financial Analysis
Financial statements provide absolute figures regarding assets, liabilities, revenues, and expenses; however, they do not inherently reveal the earning capacity, liquidity, or financial soundness of an enterprise. To make this data readily understandable to users, it must be analyzed and presented in a simplified form. Various tools and devices are employed to achieve this systematic analysis.
Types of Tools for Financial Analysis
The sources identify seven primary tools used for analyzing financial statements:
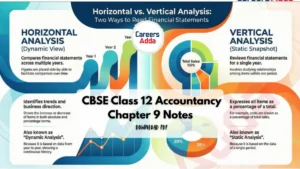
1. Comparative Statement Analysis
• This tool compares financial numbers at two points in time to derive conclusions about changes in financial position and operating results.
• Methodology: It involves placing Balance Sheet or Statement of Profit and Loss figures side-by-side to study year-to- year changes,.
• Alternate Name: This is also known as Horizontal Analysis.
• Mathematical Logic:
o Absolute Change = Current Year Figure – Previous Year Figure.
o Percentage Change = (Absolute Change ÷ Previous Year Amount) × 100.
2. Common Size Statement Analysis
• These statements indicate the relationship of various financial items to a common base by expressing each as a percentage,.
• Alternate Name: This is also known as Vertical Analysis,.
• Base Items: Usually, “Revenue from Operations” is the base for the Statement of Profit and Loss, and “Total Assets” or “Total Equity and Liabilities” is the base for the Balance Sheet.
• Mathematical Logic:
o Individual Item Percentage = (Amount of Individual Item ÷ Total or Base Amount) × 100.
3. Trend Analysis
• A technique used to study several financial statements over a series of years to observe percentage changes over time.
• Utility: It provides a long-run view of the business, pointing to basic changes in its nature and whether specific ratios are falling, rising, or remaining constant.
• Mathematical Logic:
o Trend Percentage = (Current Year Figure ÷Base Year Figure) × 100.
4. Ratio Analysis
• Definition: Accounting ratios measure the comparative significance of individual items within the income and position statements.
• Utility: It allows for the assessment of the profitability, solvency, and efficiency of an enterprise.
5. Cash Flow Analysis
• Definition: This refers to the analysis of the actual movement of cash into and out of an organization.
• Purpose: It projects how cash received was utilized and summarizes the causes for changes in the cash position between two Balance Sheet dates.
6. Fund Flow Statement
• Definition: This statement shows changes in assets, liabilities, and capital between the dates of two balance sheets.
• Utility: It indicates the causes of changes in working capital and discloses the sources and specific uses of funds during the year.
7. Break-even Point Analysis
• Definition: This represents the specific point where total costs are exactly equal to total sales.
• Characteristics: At this point, the enterprise experiences neither profit nor loss; it is also termed the ‘No-profit-No-Loss’ point.
Comparative Statements
• These statements compare financial numbers at two points in time to help derive meaningful conclusions regarding changes in financial positions and operating results.
• Methodology: Financial figures for two or more years are placed side-by-side to facilitate comparison.
• Horizontal Analysis: This analysis is also known as Horizontal Analysis because it summarizes and presents data for a number of years.
• Comparison Types:
o Intra-firm/Inter-period Comparison: Comparing financial statements of the same firm over two or more years.
o Inter-firm Comparison: Comparing financial statements of two or more different firms over a number of years.
Get the Full Accountancy Notes for Chapter 10 from the PDF


 CBSE Class 12 Accountancy Chapter 9 Note...
 Process to Challenge CUET PG 2026 Answer...
 Best Books for CUET PG LLB 2027, Check S...


 Call
Call